
Win rate, profit factor and expectancy: how to read your Trade Journal
Win rate is the number everyone quotes and the one that tells you least on its own. Half your trades can win and the strategy can still make money, or lose it. It depends on how big the wins and losses are. Here is exactly how each Journal number is calculated, checked by hand against 37 real trades.
The trades we used
All numbers and screens below come from the EZPZ Trader demo account, trading on the built-in paper account on Thursday, Oct 22, 2026. Its signals were sent to its strategies' real webhook URLs between 8:48 and 9:36 a.m. ET and filled at live prices. By the end, 37 trades were closed and none were open.
These are small trades held for a very short time: 10 shares of SPY, about 7 shares of QQQ, 14 shares of AAPL and about $2,000 of each crypto coin. The stock trades were held 31 to 51 seconds and most crypto trades a little over a minute. So the dollar amounts are small, a few dollars at most. The arithmetic is the same at any size.
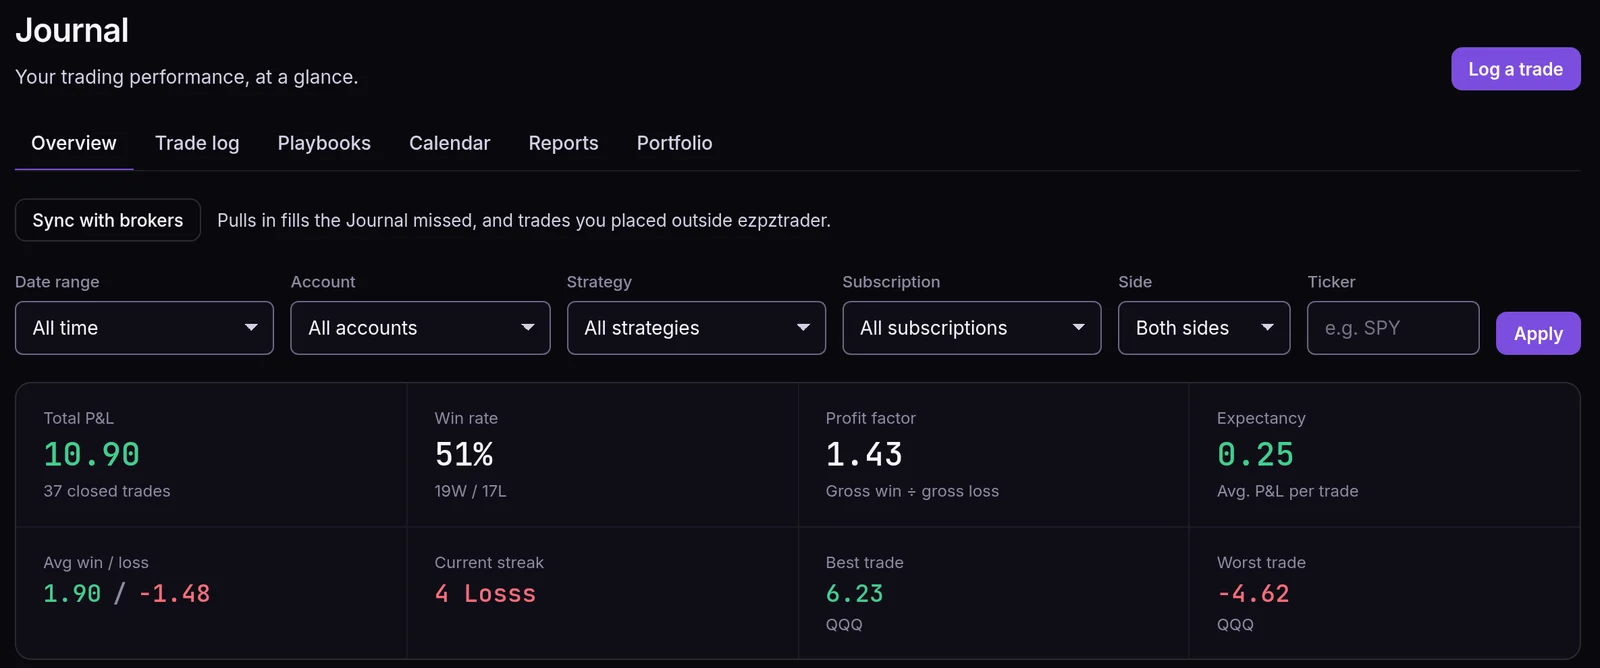
Every closed trade is a row in the Trade log, with its entry, exit and P&L.
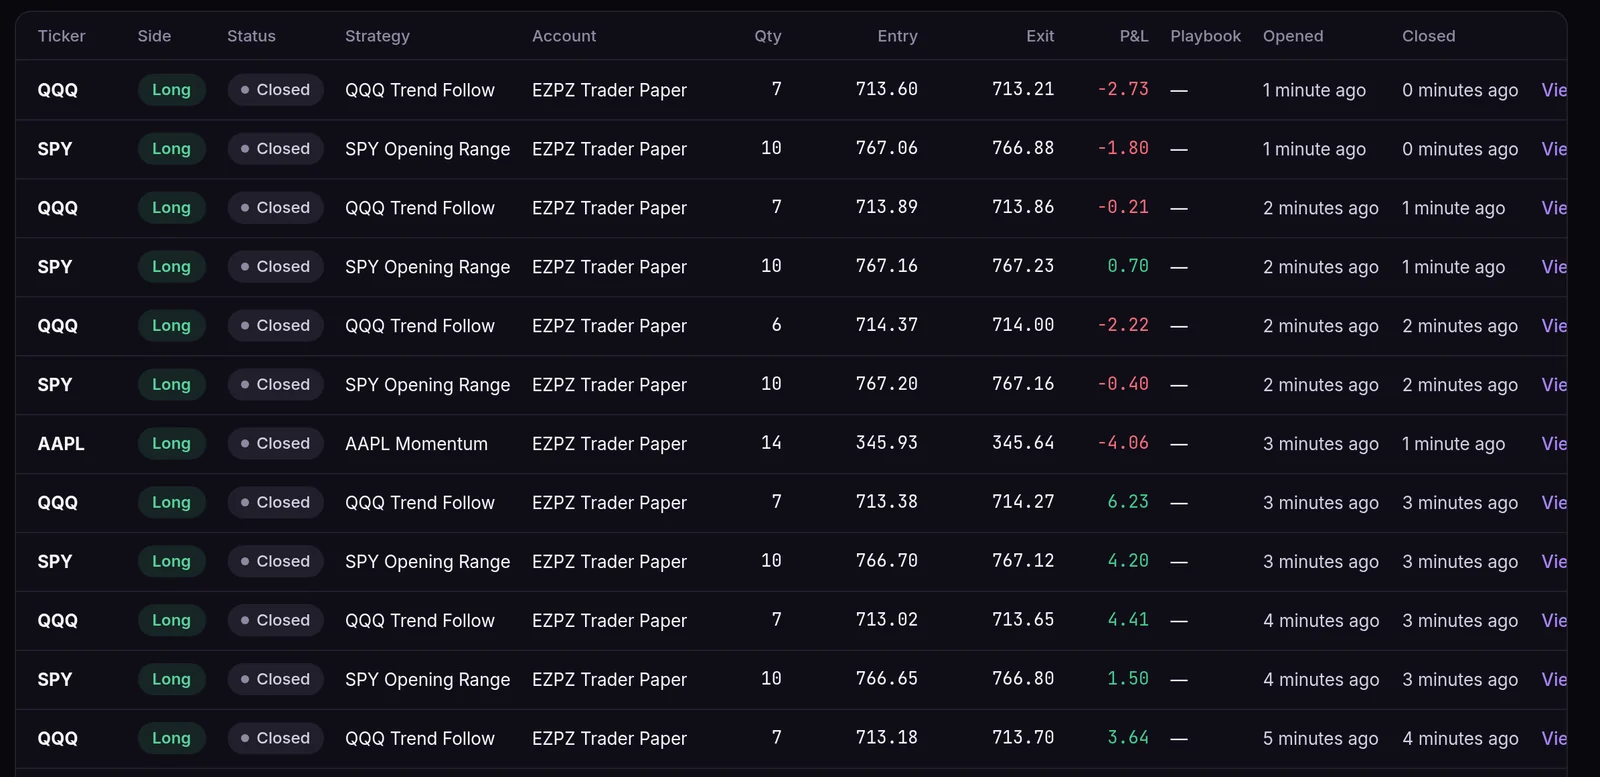
Here are the 37 trades grouped by ticker. The ETH/USD and SOL/USD trades came from the same "BTC Swing" strategy, which was sent signals for all three coins.
| Ticker | Trades | Won | Lost | Breakeven | Total won | Total lost | P&L |
|---|---|---|---|---|---|---|---|
| SPY | 8 | 5 | 3 | 0 | $11.50 | $4.40 | +$7.10 |
| QQQ | 8 | 4 | 4 | 0 | $16.17 | $9.78 | +$6.39 |
| SOL/USD | 6 | 4 | 2 | 0 | $2.45 | $0.36 | +$2.09 |
| BTC/USD | 7 | 4 | 3 | 0 | $4.97 | $5.12 | −$0.15 |
| ETH/USD | 6 | 2 | 3 | 1 | $0.99 | $1.32 | −$0.33 |
| AAPL | 2 | 0 | 2 | 0 | $0.00 | $4.20 | −$4.20 |
| All | 37 | 19 | 17 | 1 | $36.08 | $25.18 | +$10.90 |
The numbers, one at a time
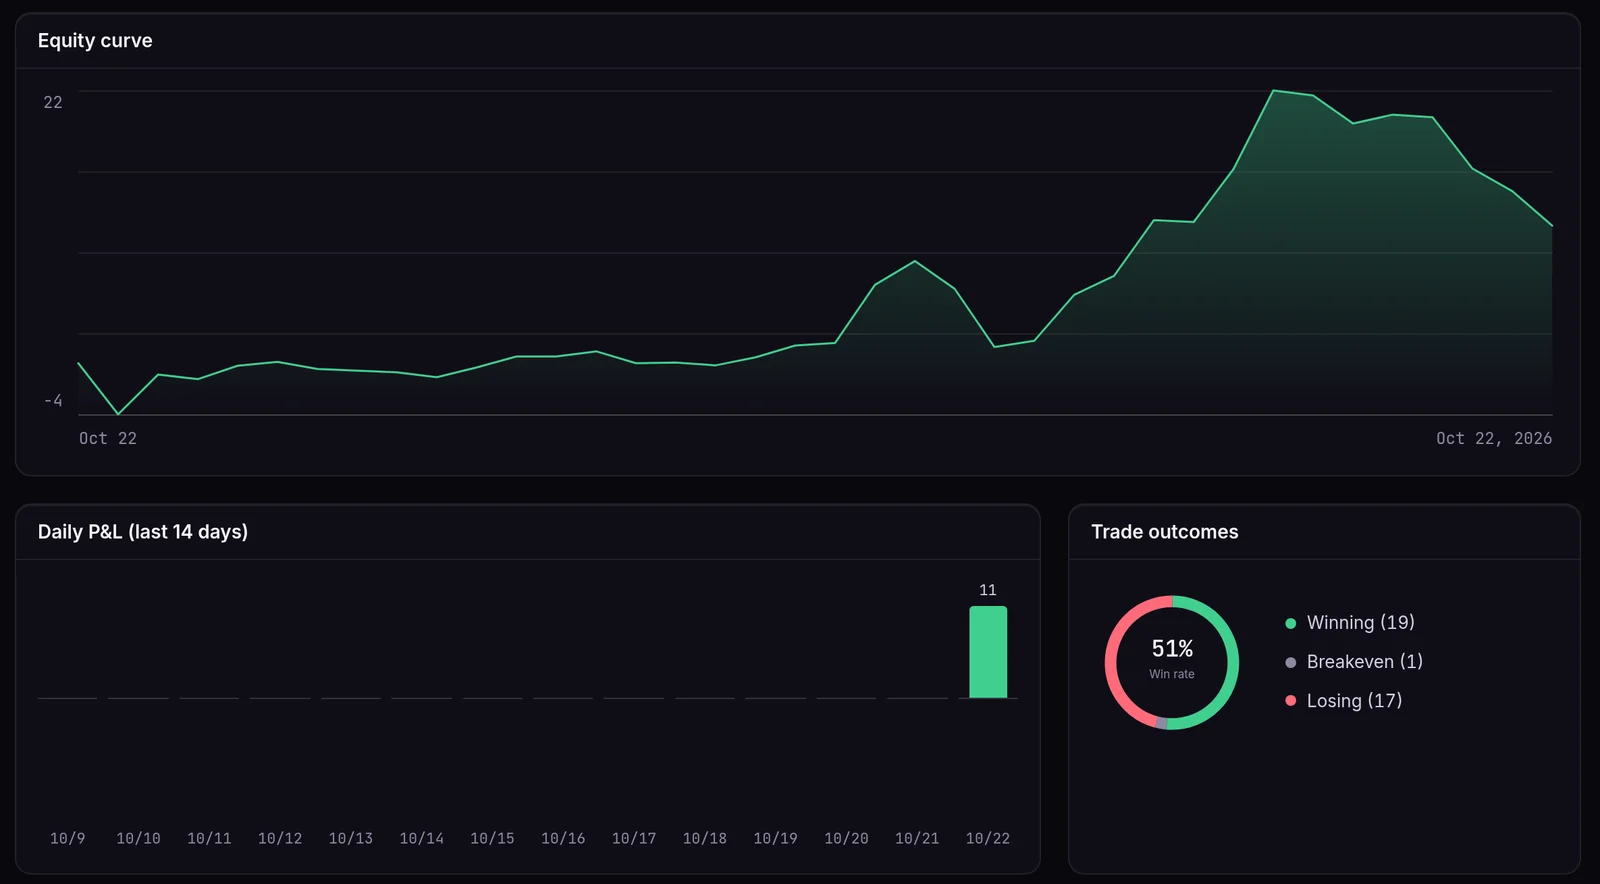
Total P&L: $10.90
Total won minus total lost: $36.08 − $25.18 = $10.90. Only closed trades count. An open trade has no realized P&L yet.
Win rate: 51%
Winners ÷ all closed trades = 19 ÷ 37 = 51.4%, shown as 51%. One ETH/USD trade closed at exactly its entry price, for $0.00. It counts in the 37 but isn't a win, so it pulls the rate down a little. That's why the card says 19W / 17L and the two don't add up to 37.
Average win and average loss: $1.90 and $1.48
Average win = $36.08 ÷ 19 = $1.90. Average loss = $25.18 ÷ 17 = $1.48. Each is an average over its own trades only, so the breakeven trade is in neither.
Profit factor: 1.43
Total won ÷ total lost = $36.08 ÷ $25.18 = 1.43. For every dollar lost, these trades made $1.43. Below 1.0 the trades are losing money. With no losing trades there's nothing to divide by, so the Journal leaves it blank.
Expectancy: +$0.25 per trade
Win rate × average win, minus (1 − win rate) × average loss:
(19 ÷ 37 × $1.899) − (18 ÷ 37 × $1.481) = $0.975 − $0.721 = +$0.25
Expectancy is the number to compare across strategies of different sizes, because it's per trade.
It's a little lower than the net P&L split evenly over the trades ($10.90 ÷ 37 = $0.29). The difference is the breakeven trade: "1 − win rate" is 18 of 37, which includes it, so the formula counts that trade at the average loss. That costs 1 ÷ 37 × $1.48 = $0.04, and $0.29 − $0.04 = $0.25. With no breakeven trades the two would match.
51%
win rate: 19 of 37 trades
1.43
profit factor: $36.08 won ÷ $25.18 lost
+$0.25
expectancy: average value of one more trade
Why a high win rate can lose money
The demo trades show the good case: about half the trades won, but the average win ($1.90) was bigger than the average loss ($1.48), so the total came out positive.
Now flip the shape. This is a made-up arithmetic example, not demo data: eight wins of $50 and two losses of $250. That's an 80% win rate, but $400 won against $500 lost, a profit factor of 0.80, and an expectancy of (0.80 × $50) − (0.20 × $250) = −$10 a trade. Strategies with tight targets and wide stops often look like this. The win rate feels great until you add the losses up.
Compare strategies, not just the account
The account total mixes every strategy together. Journal → Reports splits the same closed trades By strategy and By subscription. Each trade counts for the subscription that opened it, and the rows add up to the account total.
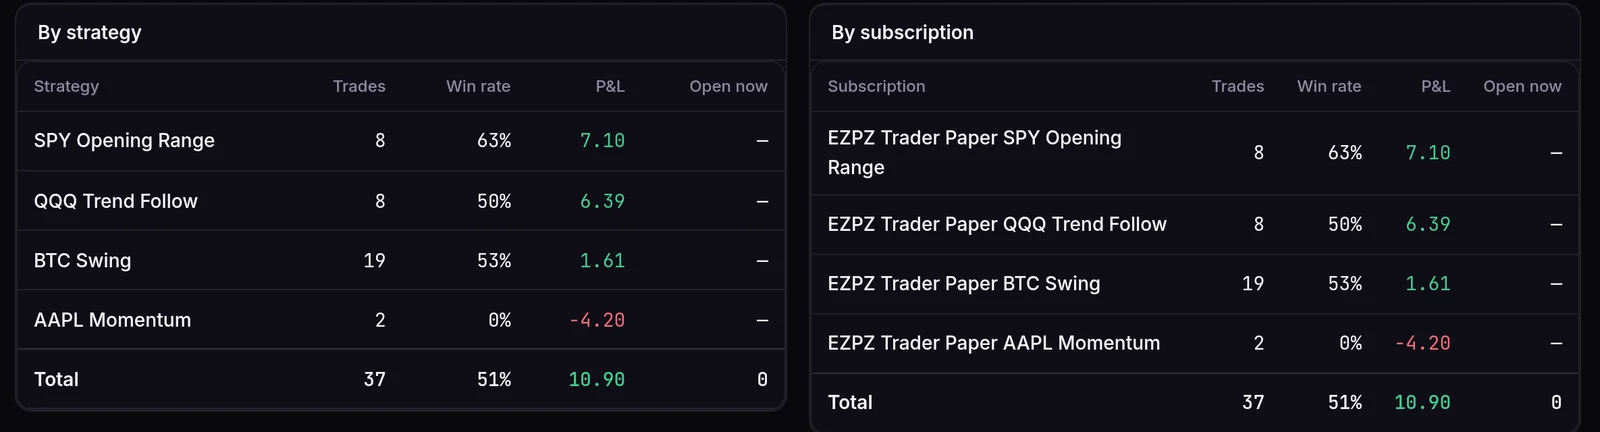
On the demo account, SPY Opening Range had the best win rate (5 of 8, 63%) and the most P&L, $7.10. QQQ Trend Follow won only half its trades but made $6.39, because its four wins ($16.17) were much bigger than its four losses ($9.78). BTC Swing traded the most, 19 times, for $1.61. AAPL Momentum lost both of its 2 trades, −$4.20.
None of this says which strategy is better. Eight trades, or two, held for a minute or so on one morning, are far too few to judge. It shows how to read the table.
The order we read them in
Expectancy
Is one more trade worth taking at all? If expectancy is negative, the rest is detail.
Profit factor
How big is the edge? Close to 1.0 means costs and slippage can wipe it out.
Win rate with average win vs average loss
How does the strategy make its money: many small wins or a few big ones? That tells you which losing streaks are normal.
Sample size
37 trades from one morning are an example, not evidence. Be careful with any number from fewer than a few dozen trades, and from a single day.
Where to look in the Journal
- Overview. These metrics for any date range, filtered by account, strategy, subscription, side or ticker, and by playbook once you have one.
- Trade log. Every closed trade with its entry, exit and P&L, so you can check any number by hand.
- Reports. By strategy and By subscription, plus P&L by symbol, time of day, duration and more.
- Calendar. Daily P&L, so you can spot a few bad days hiding inside a good month.
- Playbooks. Tag trades with your own named setups and see which ones carry the results.
Options and futures P&L include the contract multiplier, so a $1.00 move on one option contract counts as $100. Sync with brokers also brings in fills the Journal missed and trades you placed directly at your broker, so the Journal can show your whole account, not just the automated part.
Frequently asked questions
Why is my win rate lower than I expected?
Most often because of breakeven trades, which count in the total but aren't wins. On the demo account, 19 wins and 17 losses would be 53% without the breakeven trade, but the Journal shows 19 ÷ 37 = 51%.
Why is profit factor blank?
Profit factor divides by your total losses. With no losing trades in the range there's nothing to divide by, so it's left blank instead of showing infinity.
Why isn't expectancy the same as total P&L ÷ trades?
They match when there are no breakeven trades. The formula's loss side uses 1 − win rate, which includes breakeven trades, so each one is counted at the average loss. On the demo account that made expectancy $0.25 instead of $0.29.
Are paper trades included?
Yes. They're recorded as they fill, like the 37 trades in this post. Use the account filter to review paper and live separately.
What's a good expectancy?
Any positive number after costs. Compare it with your average loss: +$10 on trades that risk $100 is a thin edge, while +$10 on trades that risk $20 is a strong one.