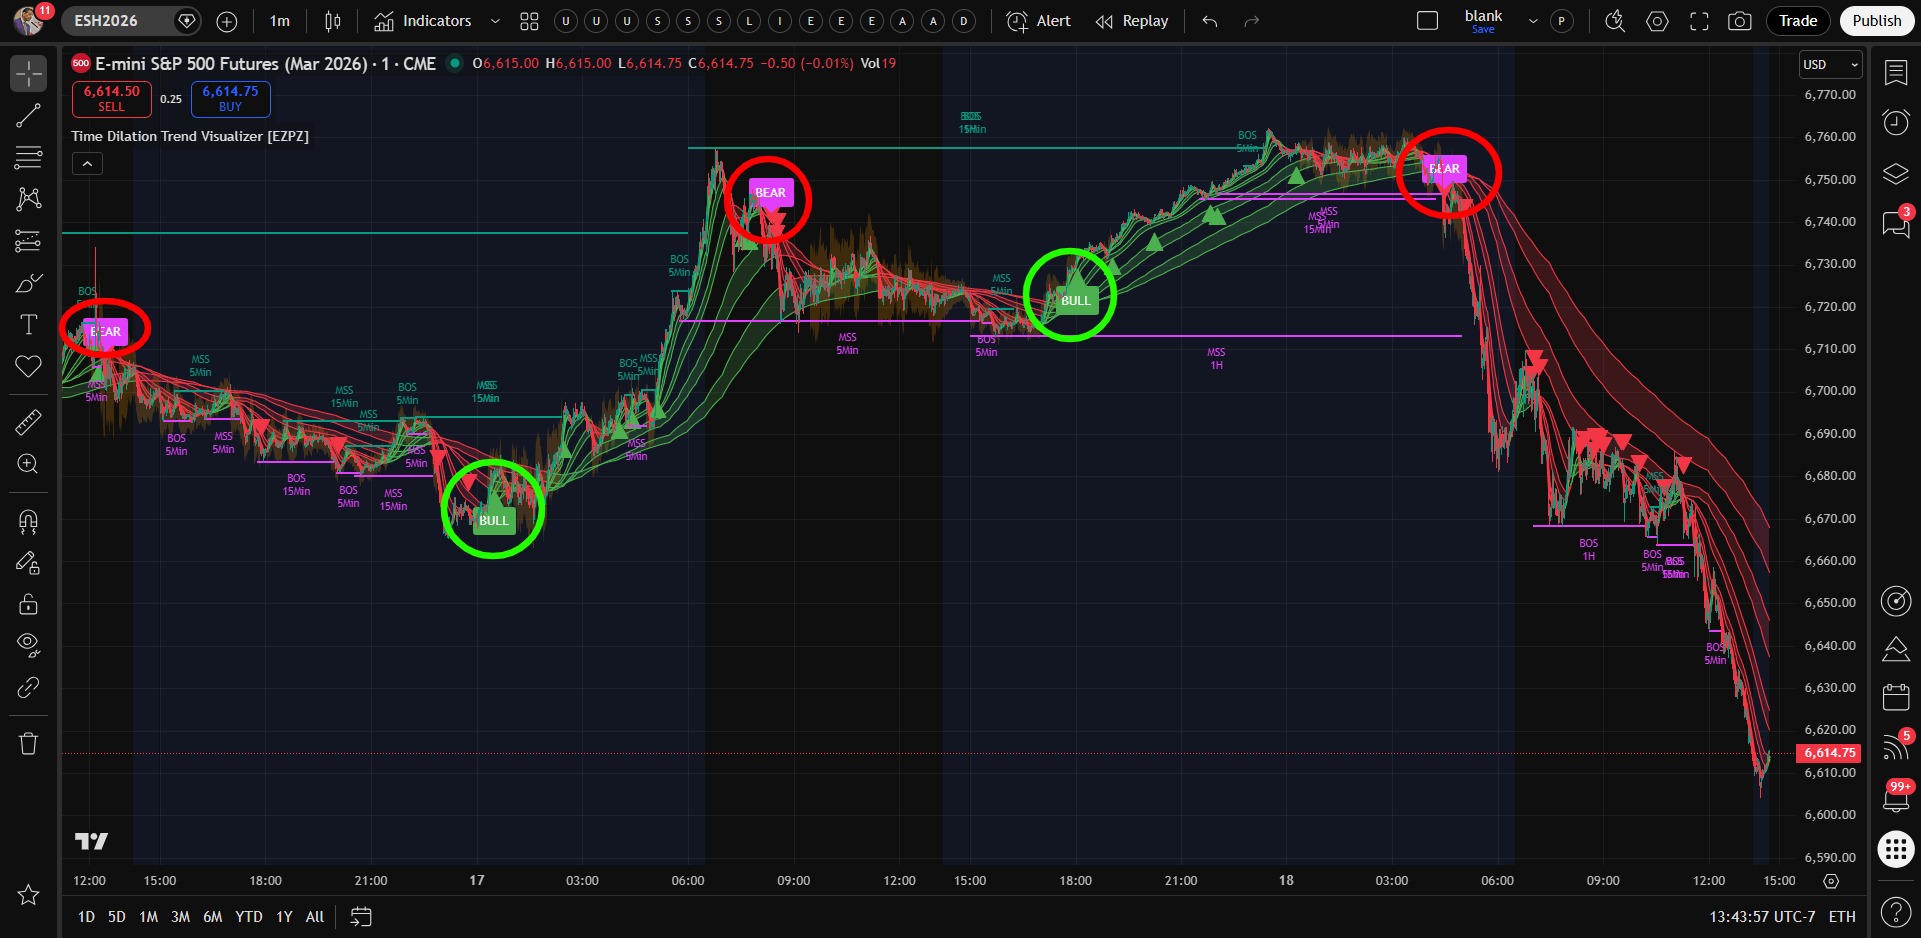
Time Dilation Visualizer
Time Dilation Trend Visualizer is a multi-timeframe trend tool that adapts to your trading style—Scalping, Intraday, Swing, or Investing—by layering dual EMAs across four timeframes to show how price

Indicators & strategies
Browse indicators and strategies built for TradingView and see how each one backtested. Buying access happens on the seller's own site. EZPZ Trader is where the alert turns into an order at your broker.
Time Dilation Trend Visualizer is a multi-timeframe trend tool that adapts to your trading style—Scalping, Intraday, Swing, or Investing—by layering dual EMAs across four timeframes to show how price
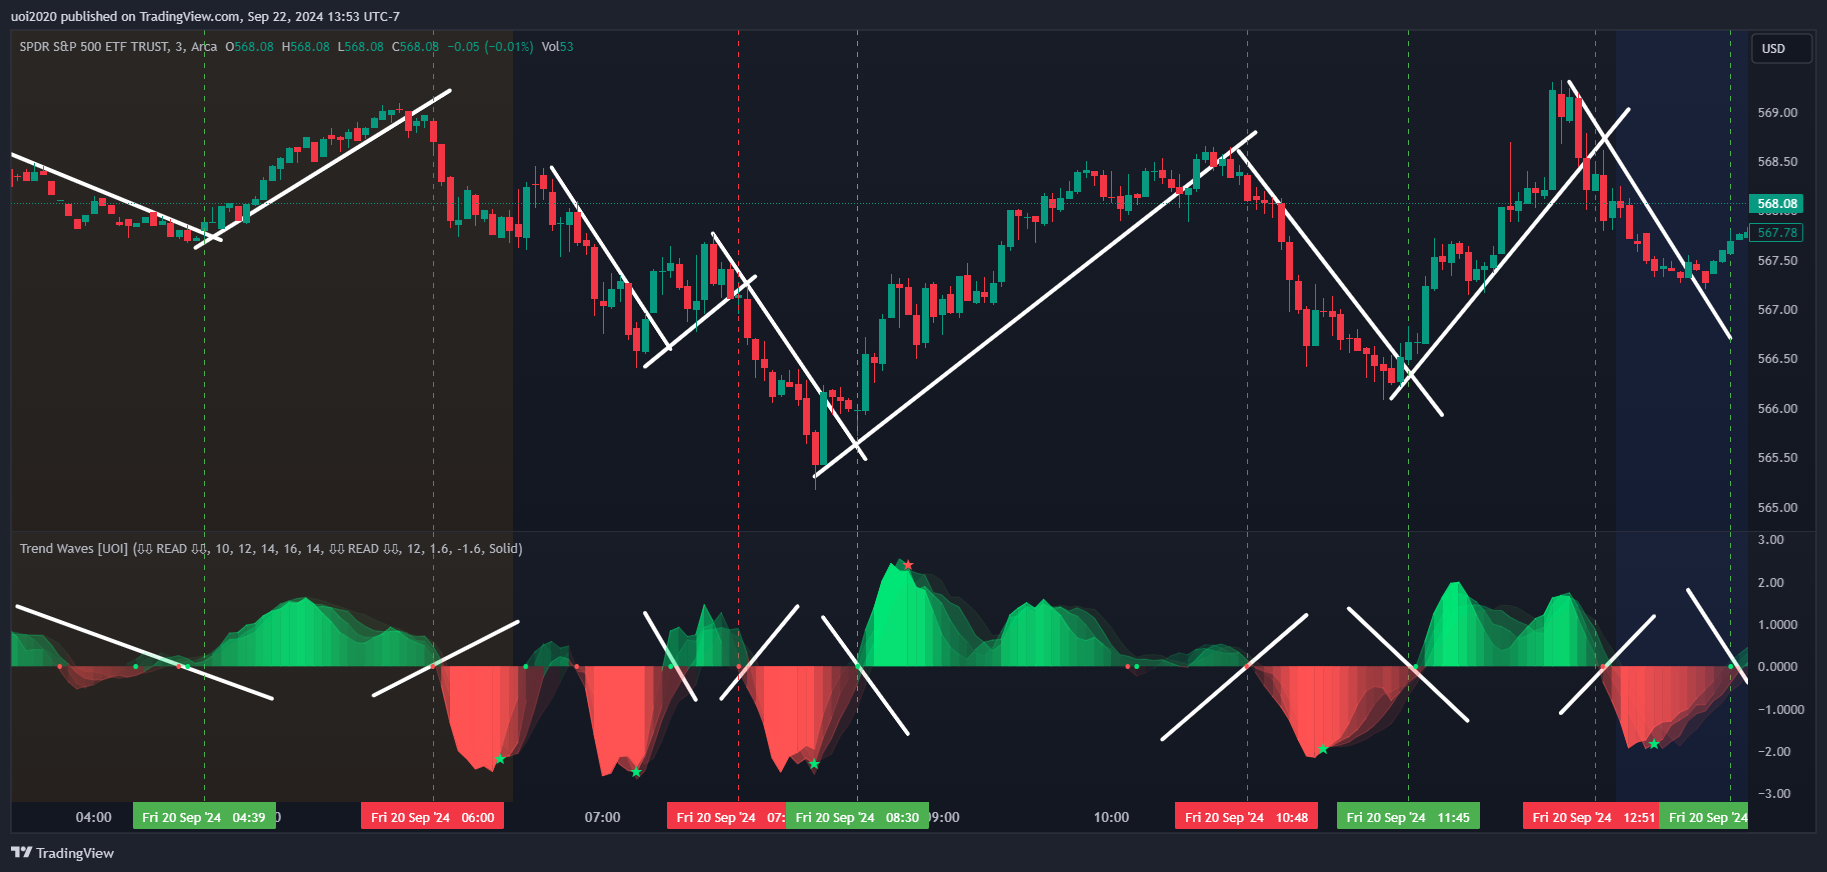
This trend indicator, titled "Trend Waves: Inline or Deviation From Trend ", is a customizable trend-following oscillator designed to analyze and visualize deviations from a chosen trend length across
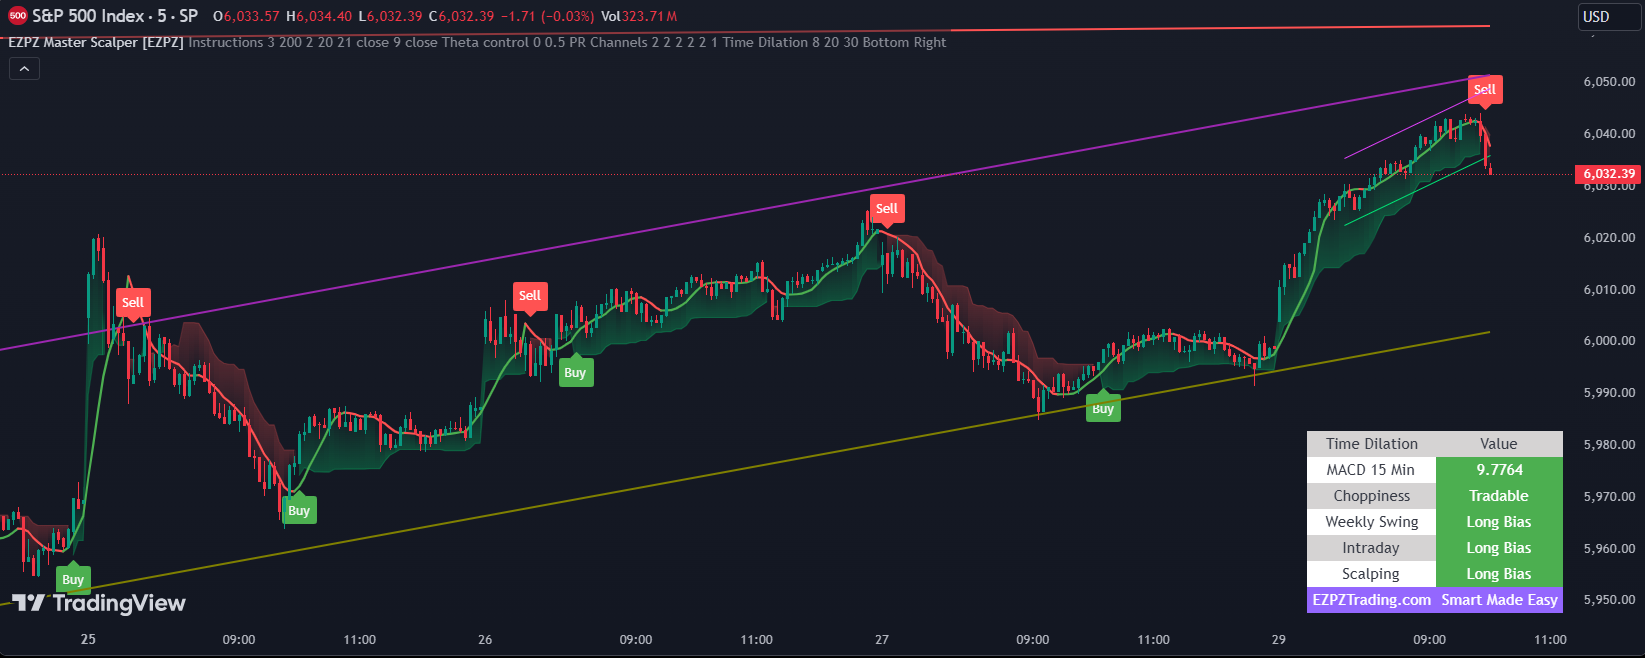
The EZPZ Master Scalper is designed to provide precise trend identification and scalping opportunities in fast-moving markets. This indicator incorporates multiple technical analysis methodologies, in
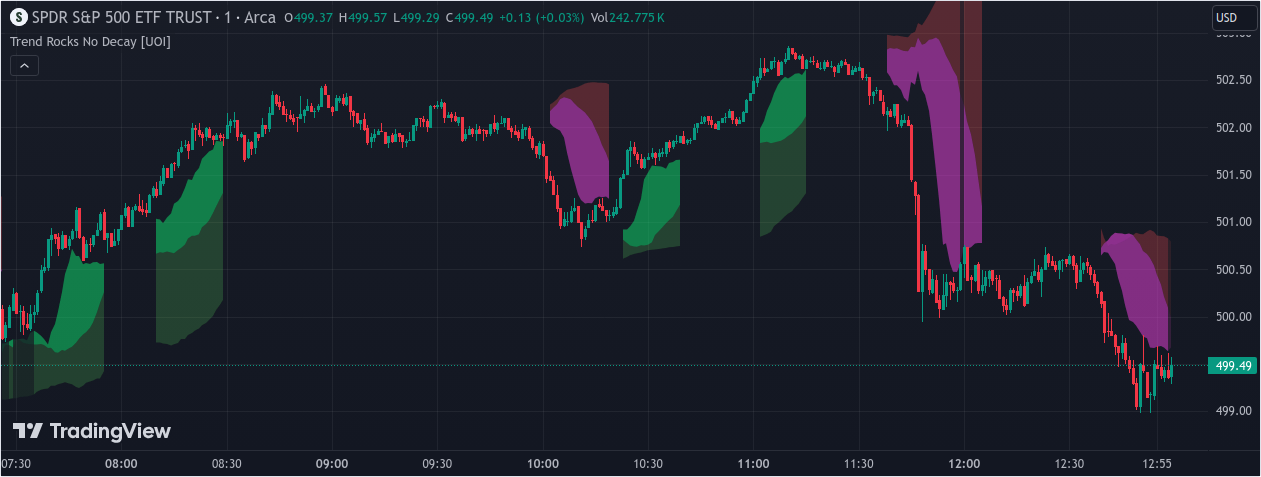
The "Trend Rocks No Decay " indicator is designed to be your navigator through the complex world of market trends, aiming to steer you clear of the choppy waters of market volatility while capturing t
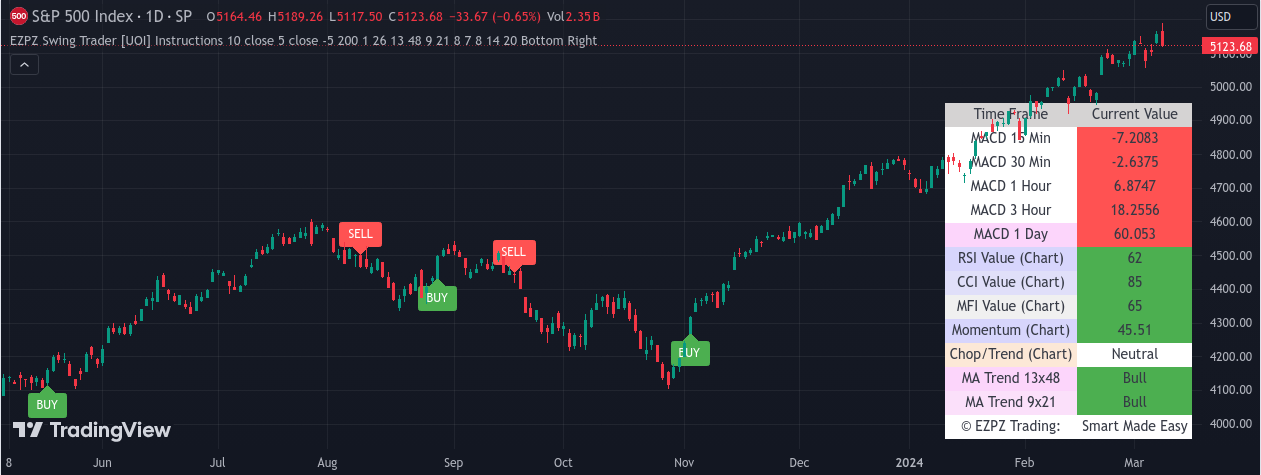
The "EZPZ Swing Trader " indicator is designed for swing traders looking for a comprehensive tool that combines multiple technical analysis techniques to generate buy and sell signals. This indicator
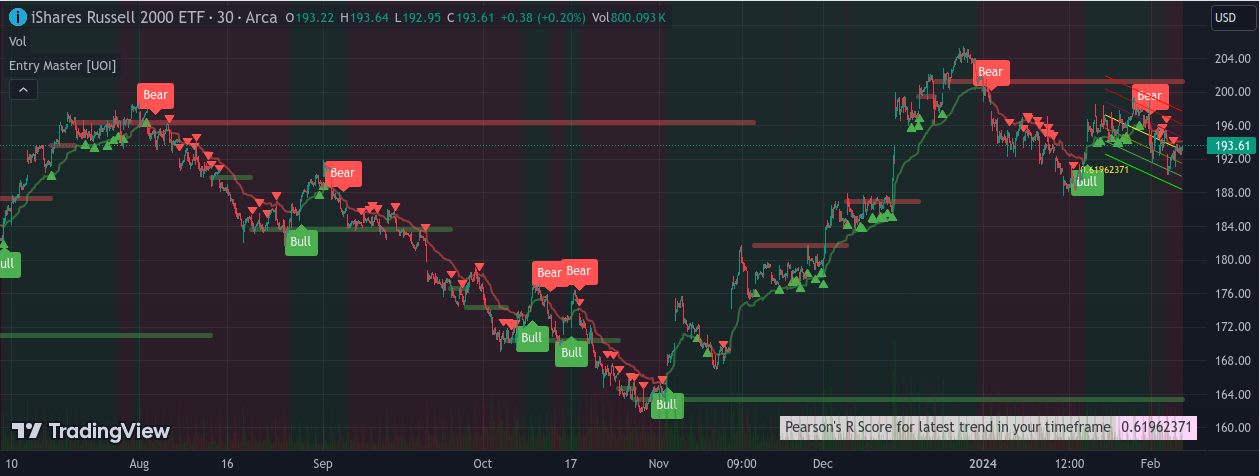
This is a multi indicator trade entry indicator pack based on multiple "if conditions" that signals good entry points when price has a direction/trend confirmed by multiple technical indicators and de
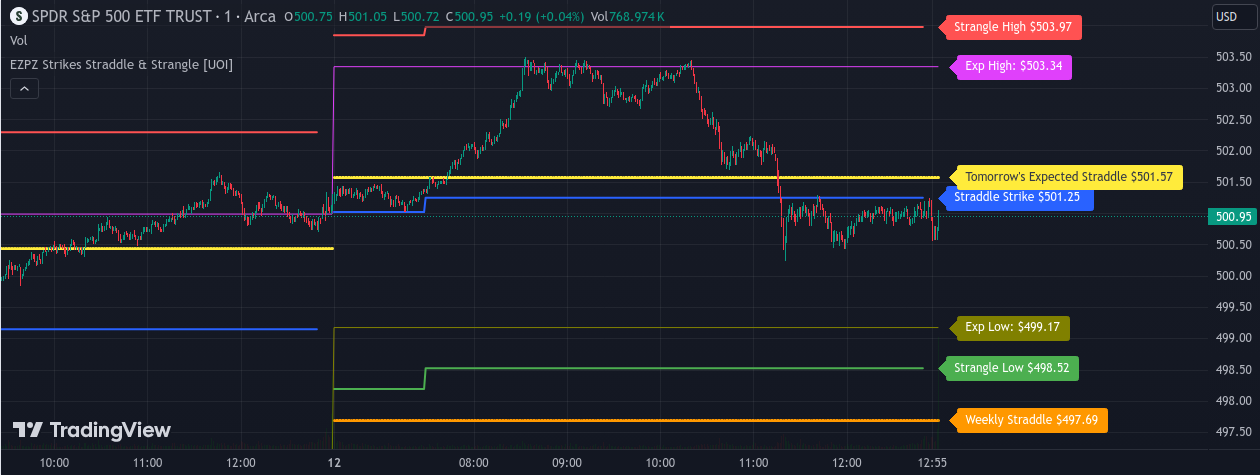
EZPZ Strikes Straddle / Strangle - The Ultimate Options Trading Tool on TradingView Unveil the power of EZPZ Options Strikes , the quintessential assistant for options traders on TradingView. Designe
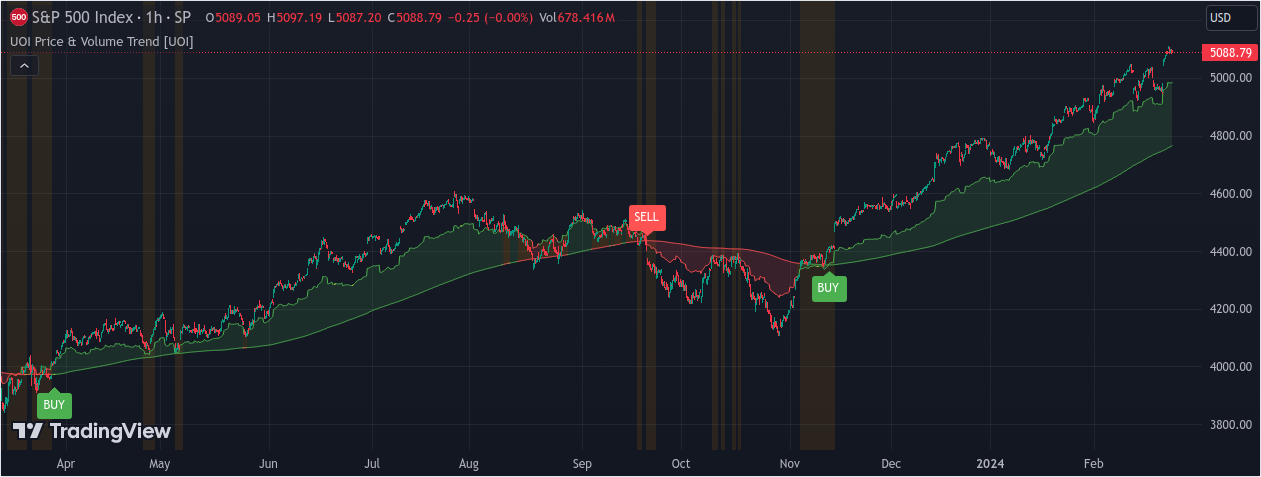
In the dynamic world of trading, mastering the intricate dance between price action, volume, and their relationship is the key to success. The "UOI Price & Volume Trend" indicator empowers traders by
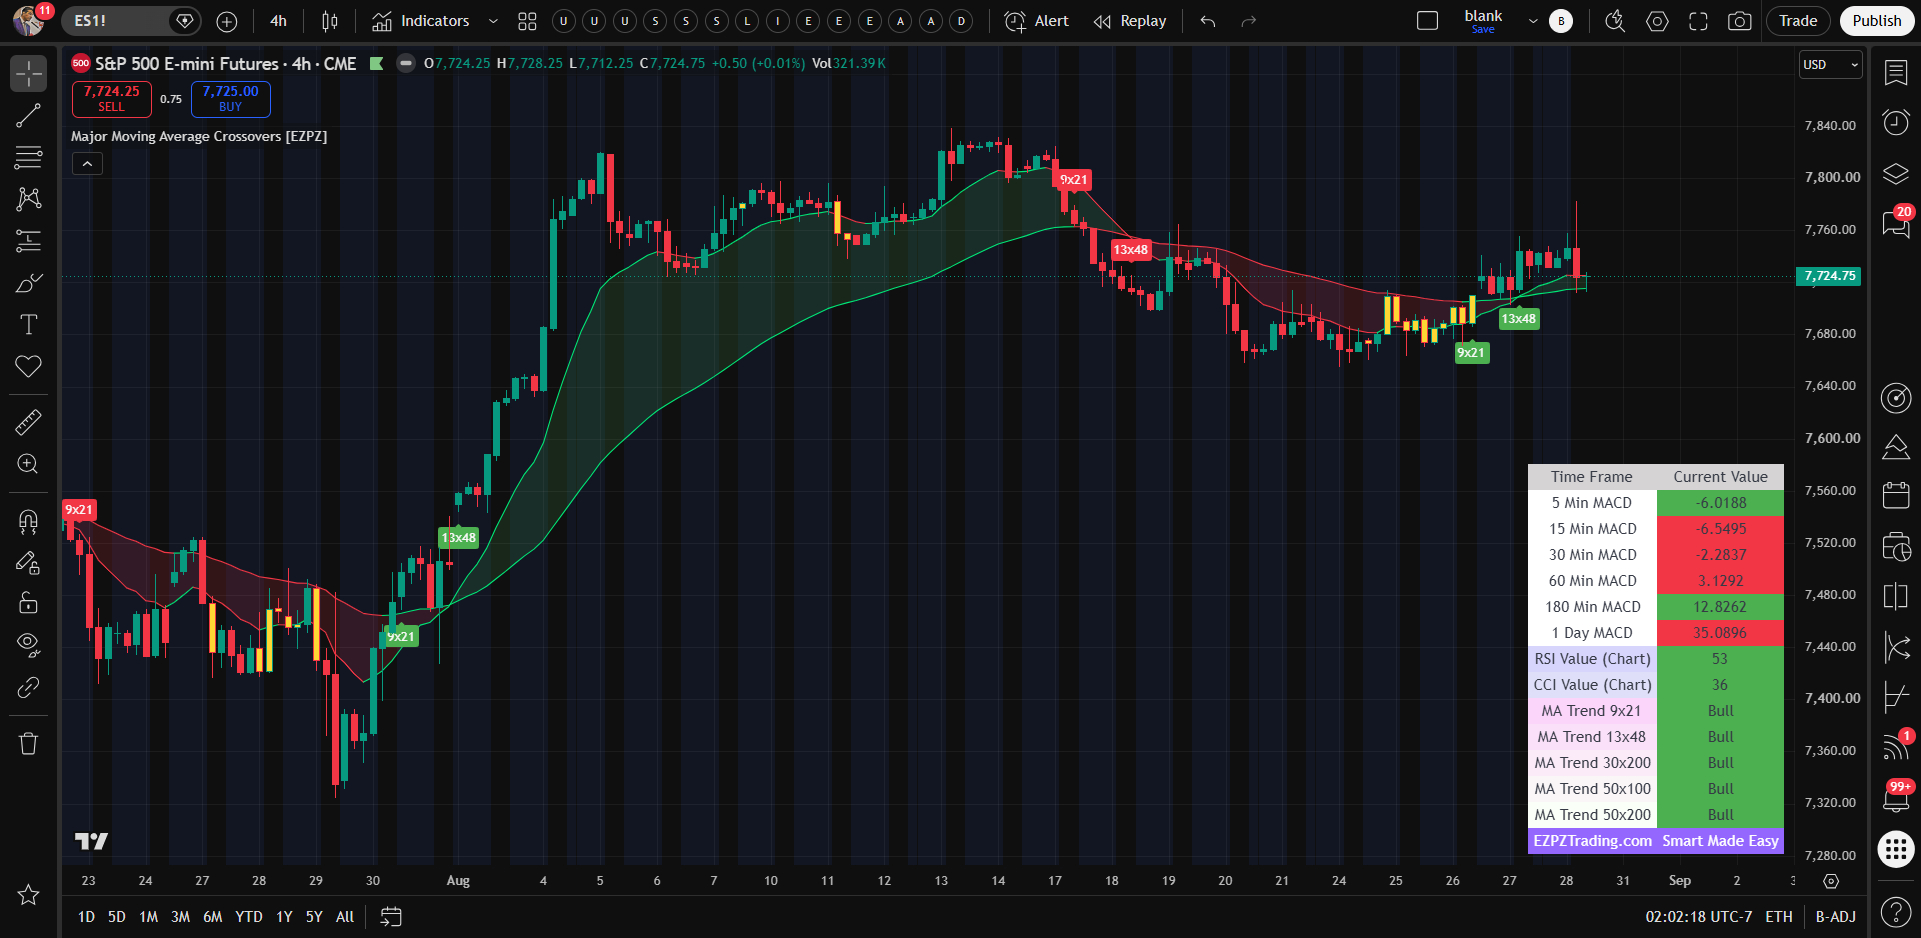
The Moving Average Crossover Strategy is a technical indicator designed to help retail investors identify potential buy and sell signals based on the crossover of two different moving averages.
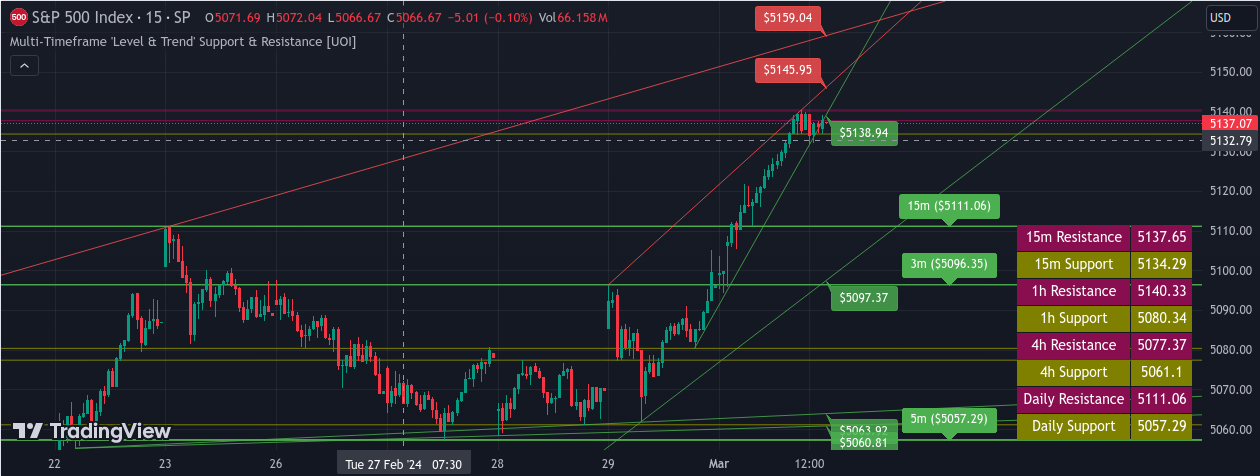
The Timeframe-based Support & Resistance level for both intraday and swing trading indicator is a sophisticated algorithm that uses pivots (high and low) to give users critical information about the c
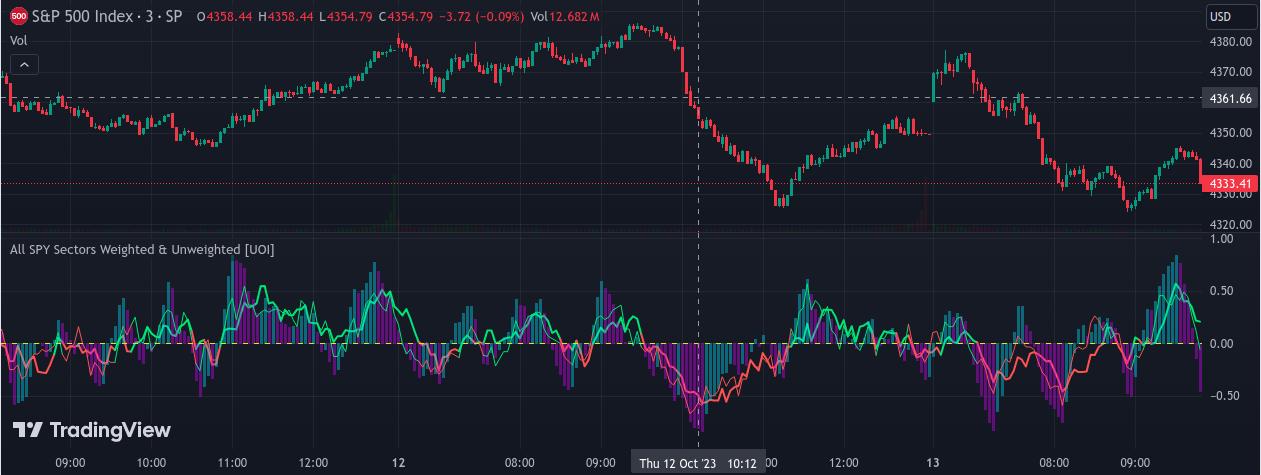
This indicator analyzes the performance of various sectors within the SPY, taking into account their respective weights in the SPY's market cap. It retrieves the closing prices of different sectors an
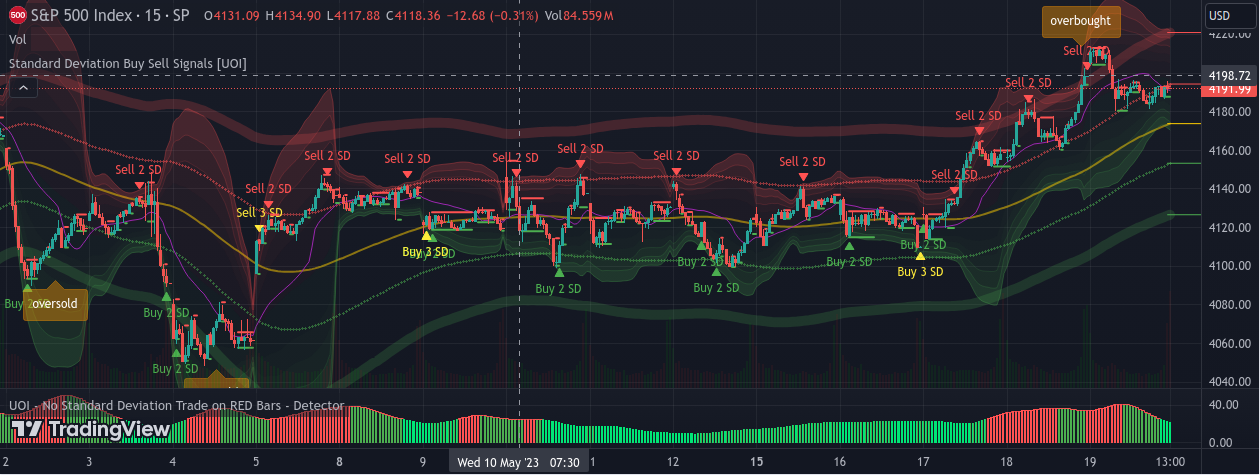
The "Standard Deviation Buy Sell Signals" which is a Mean and VWAP Deviation Super Pack that includes many additional features is an advanced technical analysis tool designed to assist traders in maki
No indicators match your search.
Indicators couldn't be loaded. Check your connection and try again.