

Indicators / Multi-Timeframe 'Level & Trend' Support & Resistance [UOI]
Multi-Timeframe 'Level & Trend' Support & Resistance [UOI]
TradingView ↗
Stocks
Discretionary
The Timeframe-based Support & Resistance level for both intraday and swing trading indicator is a sophisticated algorithm that uses pivots (high and low) to give users critical information about the c
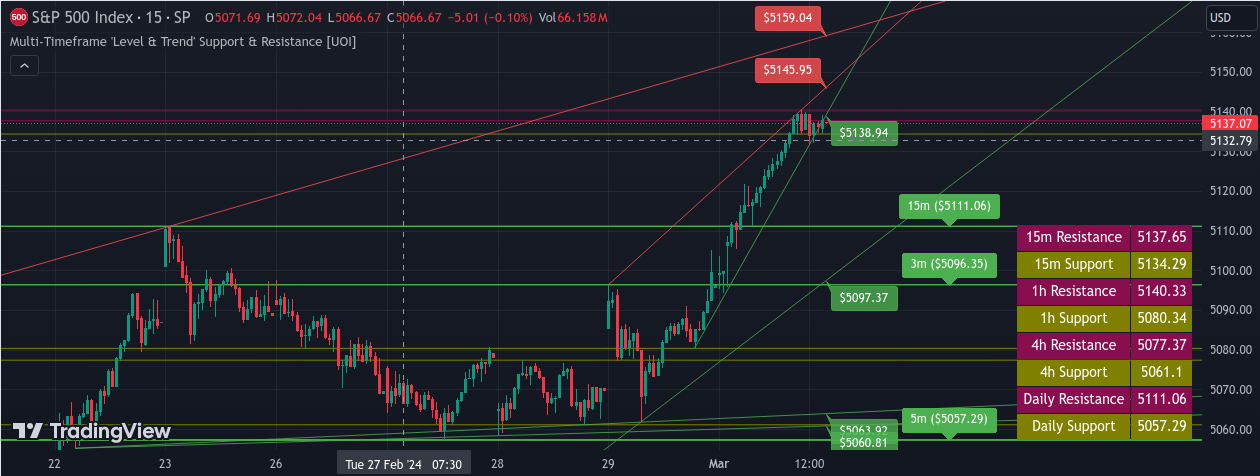
The Timeframe-based Support & Resistance level for both intraday and swing trading indicator is a sophisticated algorithm that uses pivots (high and low) to give users critical information about the current market environment across multiple timeframes. The script employs a library for global automation from the developer, jordanfray. This indicator provides multiple levels of enhancement and increase in the number of employable timeframes and levels.
The indicator is highly customizable (see indicator setting) , allowing users to modify various settings to tailor it to their specific needs for day trading or swing trading. It features six separate adjustable timeframes, each of which can be enabled or disabled independently. The input fields enable users to adjust the look-back and look-ahead periods for support and resistance calculations, providing a degree of flexibility to accommodate different trading styles and timeframe.
Support and resistance levels are displayed on the chart as lines with user-adjustable colors. In addition, the user can configure the support and resistance ranges for each timeframe, influencing how wide the zones around these levels are.
Each timeframe's support and resistance levels are calculated using pivot high and pivot low methods, and are visually represented as lines on the chart. Labels are generated for each level to easily identify the corresponding timeframe.
This indicator is ideal for traders who incorporate support and resistance levels into their strategy, especially if they operate on multiple timeframes. By overlaying these levels from different timeframes, traders can identify potential areas of confluence which can often act as significant levels in the market.
The indicator is highly customizable (see indicator setting) , allowing users to modify various settings to tailor it to their specific needs for day trading or swing trading. It features six separate adjustable timeframes, each of which can be enabled or disabled independently. The input fields enable users to adjust the look-back and look-ahead periods for support and resistance calculations, providing a degree of flexibility to accommodate different trading styles and timeframe.
Support and resistance levels are displayed on the chart as lines with user-adjustable colors. In addition, the user can configure the support and resistance ranges for each timeframe, influencing how wide the zones around these levels are.
Each timeframe's support and resistance levels are calculated using pivot high and pivot low methods, and are visually represented as lines on the chart. Labels are generated for each level to easily identify the corresponding timeframe.
This indicator is ideal for traders who incorporate support and resistance levels into their strategy, especially if they operate on multiple timeframes. By overlaying these levels from different timeframes, traders can identify potential areas of confluence which can often act as significant levels in the market.
Ready to trade this?
Once you have this indicator on your TradingView chart with an alert set up, connect it to a broker here.
Start with this indicator